Risks and Success Factors of IT Projects
According to a survey conducted by Standish Group, 70% of IT projects fail to deliver satisfactory results from an end-user perspective. Projects either fail completely or cannot deliver results within the time or budget.
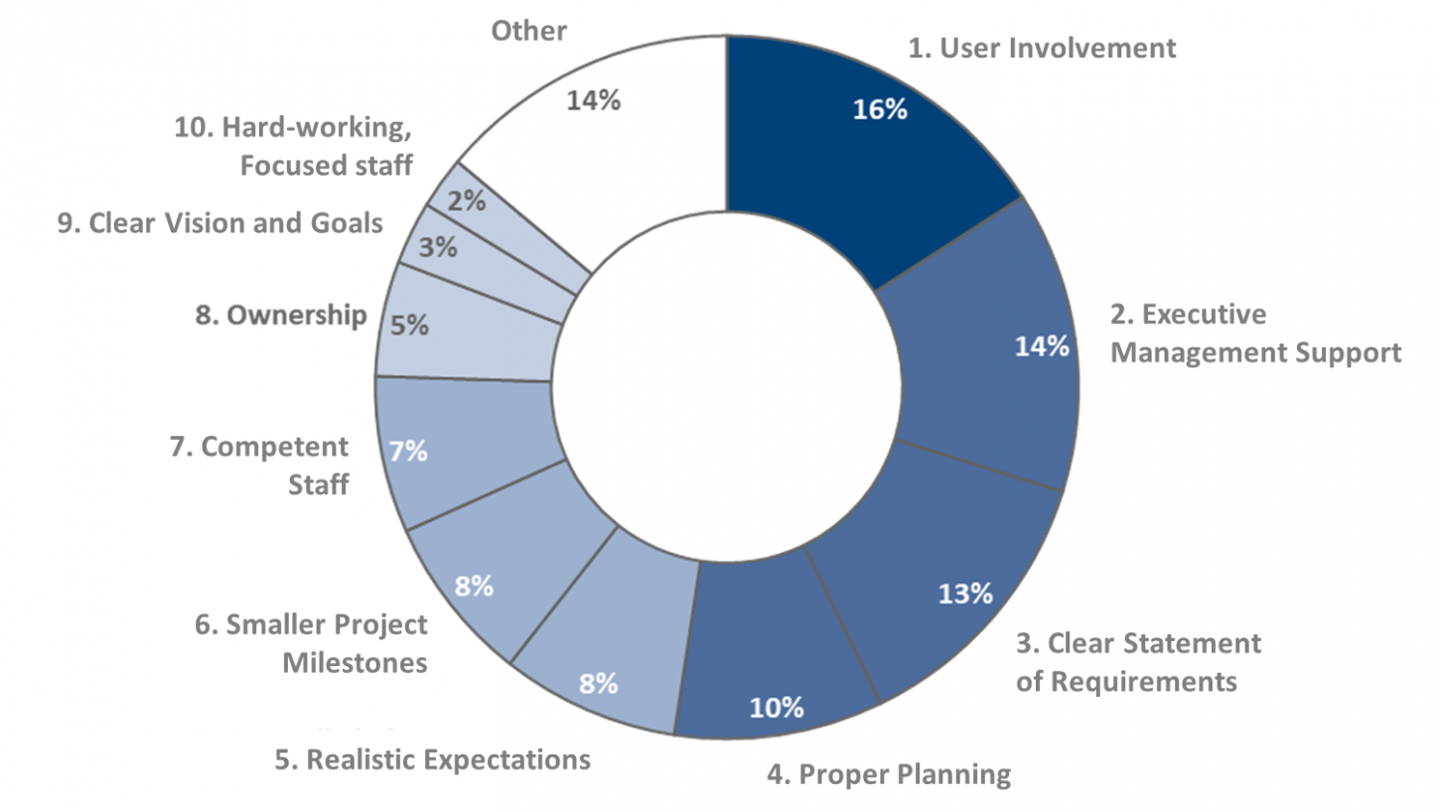
The risk of project failure increases disproportionally to project size. The direct and indirect costs of project failure have often a significant negative impact on overall business operation. Success of an IT project relies on three key factors: involvement of users (16%); top management support (14%); and clear specification of requirements (13%).
Delivering an IT project using an agile approach is proven to be 3 times more successful compared to the classic “waterfall” approach. Consequently, possessing a skilled workforce comprised of employees trained in these agile methods is the core principle underlining any successful project.
Status Quo
The rate of failure for IT projects is extremely high. According to a survey conducted by Standish Group, 70% of IT projects fail to deliver satisfactory results from an end-user perspective. \n\nProjects either fail completely or cannot deliver results within time of budget. This is demonstrated by the lack of improvement in IT project success rate between 2011 and 2015 (See Exhibit 1).
Risk of failure or significant divergence from the expected time, budget or user satisfaction, increases disproportionally with project size.
Small projects have a significantly higher success rate (61%) compared to large projects (6%). This is due to the greater complexity of large IT projects, thus increased opportunity for problems to evolve (See Exhibit 2)
Project failure triggers multiple direct and indirect costs, negatively impacting overall business operation. The financial loss stemming from unavoidable excess expenses is often only the most obvious impact following business failure. Another common effect is the loss of human capital and thus knowledge. Companies often choose to revert to their previous outdated legacy systems or manual operations, prompting the return of the same issues once faced in the past. Based on their negative experience, an acquired level of fear may now inhibit a company’s innovation and restrict the implementation of new products and better functionality. Worst-case scenario, the company can experience prolonged damage to its reputation often related to a loss of both customers and revenue, demonstrated by the DHL IT project “New Forwarding Environment (NFE)“ in 2016.
Furthermore, failure of such major projects introduce skepticism and a reluctance to initiate future large-scale changes and transformation projects. Consequently, to minimize the possibility of failure, it is critical to actively monitor and manage the risk throughout the entire project’s life cycle. Nonetheless, the success factors detailed below can guarantee a solid project foundation.
Success Factors for IT Projects

The Standish Group survey, based on results from the IT leaders in 2015, suggests a ranking of success factors. The following three elements have been identified as most crucial for project success: involvement of users (16%); top management support (14%); and clear definition of requirements (13%). Additionally, a number of other factors also positively influence the success of IT projects. An overview of these principles and their ranking according to IT leaders is illustrated in Exhibit 3
Project experience confirms that successfully implementing these factors can significantly reduce the risk of failure. Companies often focus too strongly on formal processes and reporting structures; these quickly become outdated and must be adapted only shortly after project onset.
Thus, delivering an IT project using an agile approach is proven to be 3 times more successful than the classic “waterfall” approach. Consequently, possessing a skilled workforce comprised of employees trained in these agile methods is the core principle underlining any successful project. Without such employees, the risk of complete or partial project failure, including deviations in time, budget or user satisfaction, increases to more than 80%.
Sources:
- Standish Group: “Chaos Report 2015”, (based on ca. 50.000 projects in the CHAOS database from 2011-2015)
- Standish Group: “Project Smart 2014”
- Carsten Nallinger: “Neue IT Lösungen für DHL”, Eurotransport (09.06.2016), https://www.eurotransport.de/artikel/neue-it-loesungen-fuer-dhl-500-millionen-euro-verbrannt-8035012.html, last view on 04.01.2019


